- About
About RCEC

Faculty/Staff

Education/Visiting/Others

- Our Research
- News
About RCEC
Faculty/Staff

Education/Visiting/Others

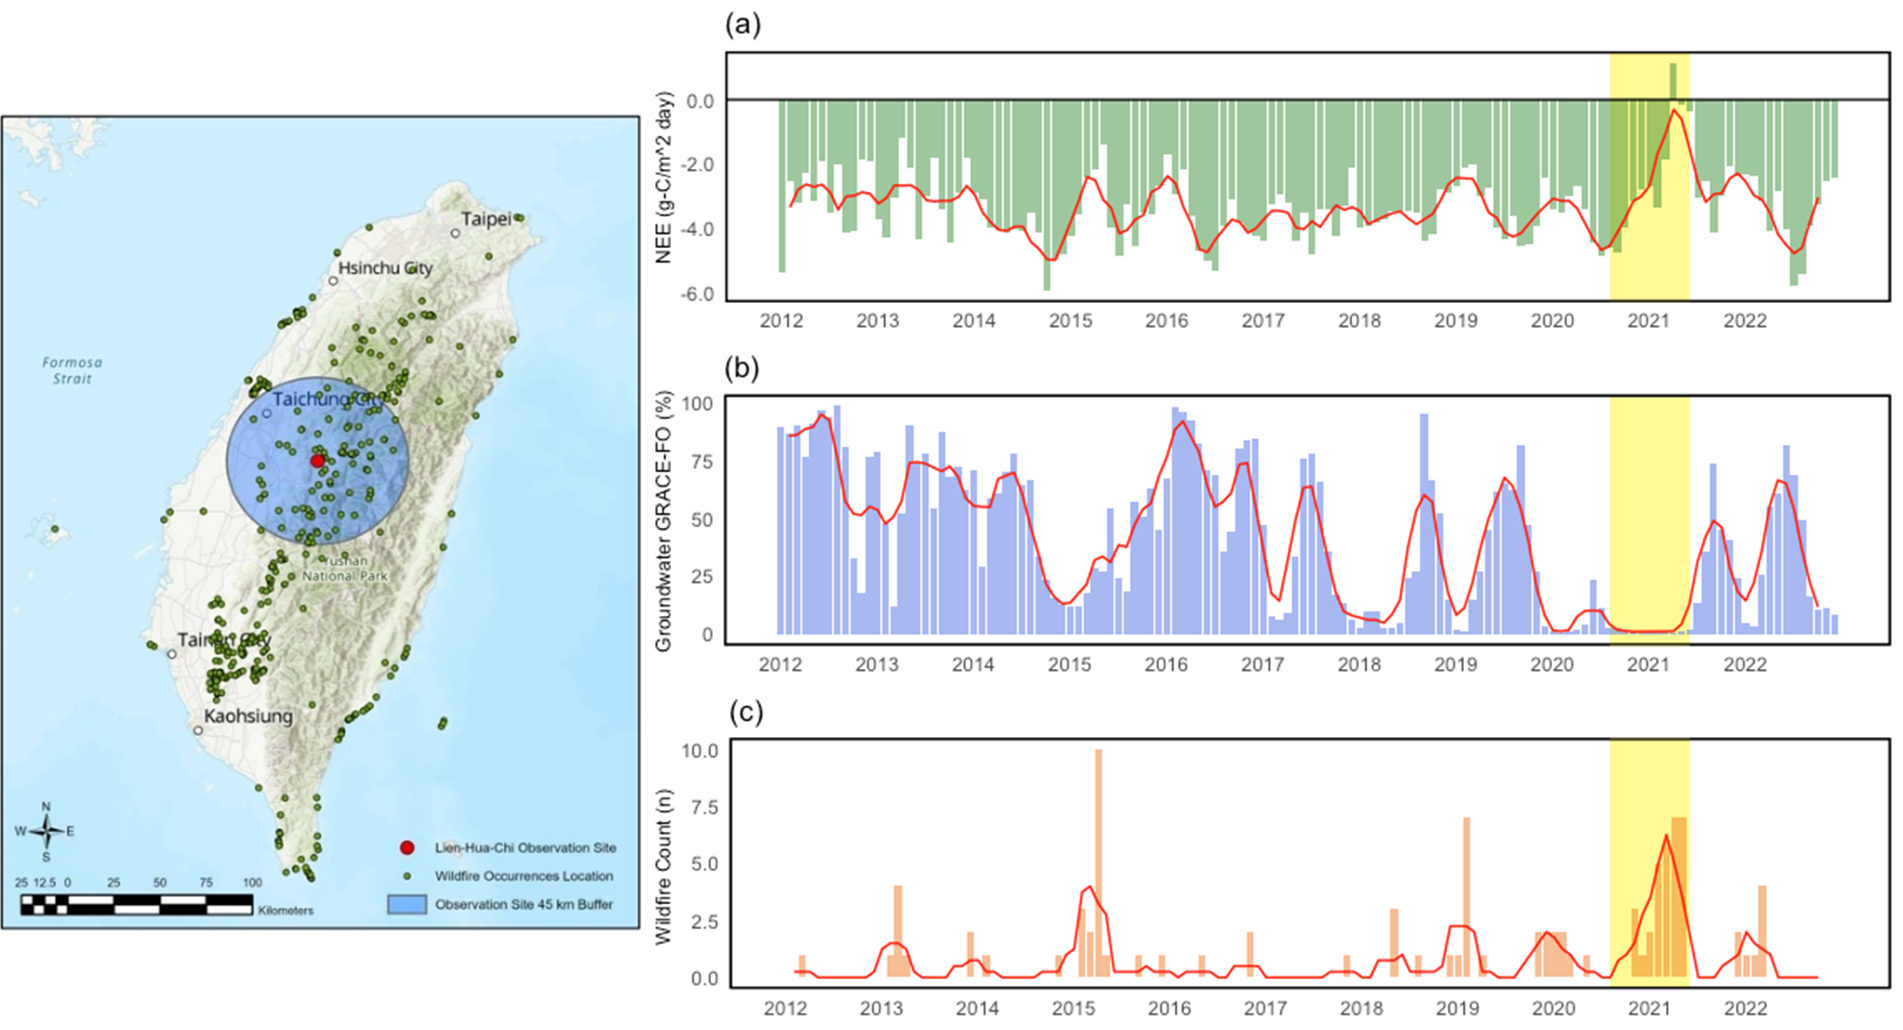
Historical Wildfire Distribution during 2012-2022 in Taiwan (map) and Time Series of NEE (a), Groundwater (b), Wildfire Count (c), where contains monthly value (bars) and 4-month moving average (lines, centered). The Lien-Hua-Chih Hydrometeorological Observatory is located at the center of the 45-km circle that includes the wildfires in (c).
Key points
More information
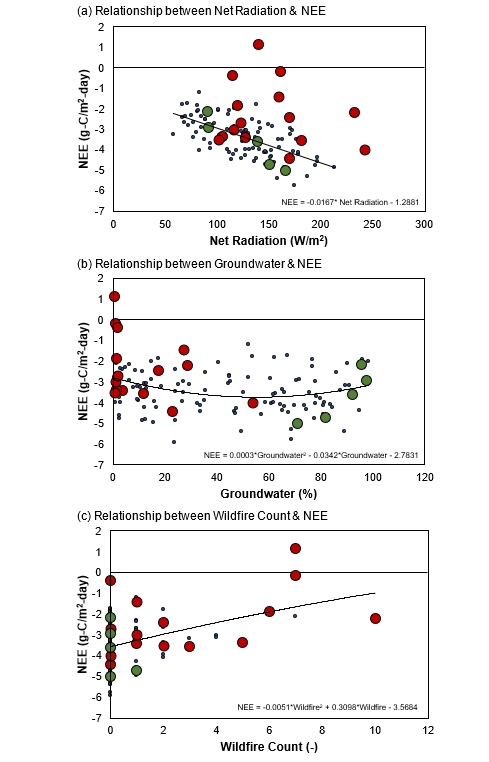
1 Red dots indicate the epicenter of major droughts (2015 Feb-Jun, 2020 Feb-Jun, 2021 Feb-Jun); Green dots indicate the epicenter of NEE drops (2016 Feb-Jun); Blue dots indicate the rest of the period. 2 The trend line in Figure a is calculated excluding the samples represented by red dots.
Scatter diagrams between NEE and Groundwater (a), Net Radiation (b), and Wildfire Count (c).