- About
About RCEC

Faculty/Staff

Education/Visiting/Others

- Our Research
- News
About RCEC
Faculty/Staff
Education/Visiting/Others

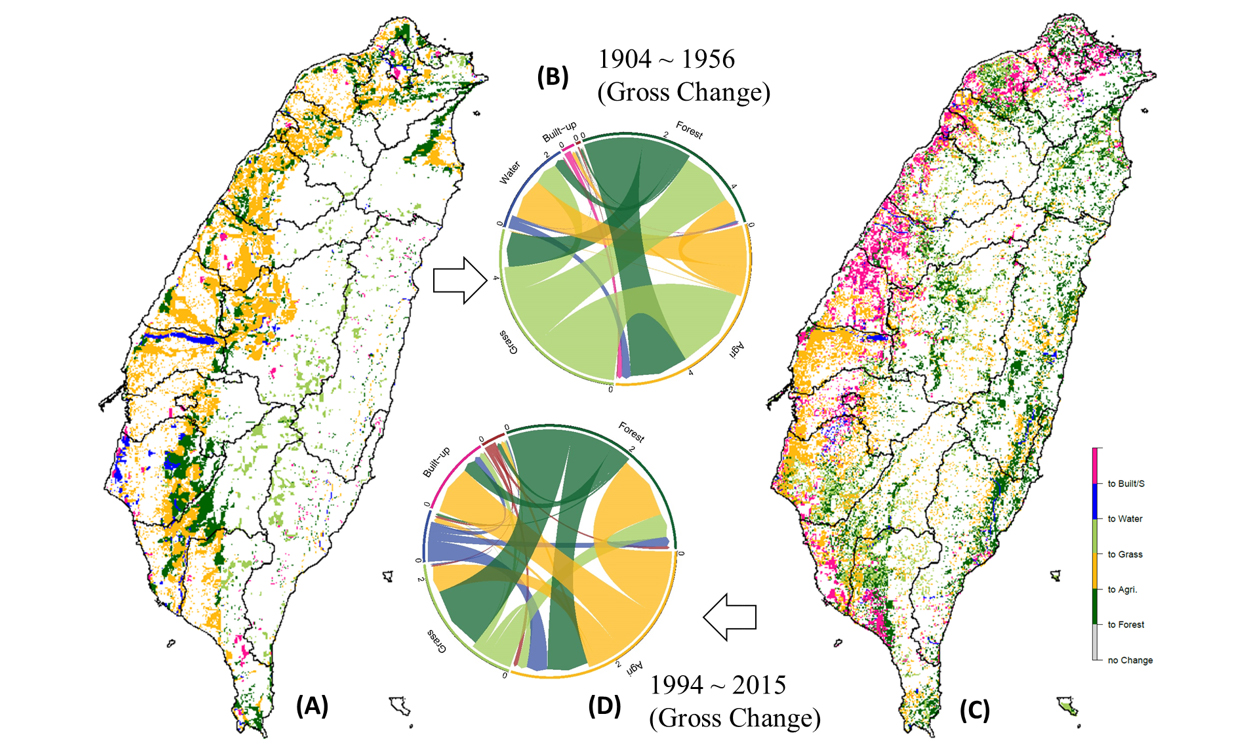
Figure Caption: Land cover change map during 1904 to 1956 was shown in the subplot (A). The color in yellow, green, blue, pink, and white represent an area converting to a new agriculture land, forest, grassland; built-up land, and without any change, respectively. The analysis of gross (bi-lateral) land cover change over this period was shown in subplot (B). The land type of new agriculture was converting from the forest and grassland types. Land cover change map during 1904 to 1956 was also shown in the subplot (C). The result of the gross land cover change was shown in the subplot (D). The forest, built-up, and agriculture land types dominated the major land cover changes over this period. The distribution of the new forests was spatial evenly distributed in the lowland of Taiwan, which was mainly converted from the agriculture land. (all units in 103 km2)
Do you know the effects of Taiwan’s land cover changes on the climate change in Taiwan in the past ? First of all, you may need to reconstruct the historical land cover information from multi-data sources, such as atlas in the libraries, historical records/reports, and satellite images. In this study, a new reconstitution of Taiwan’s land cover changes and its uncertainty between 1904 and 2015 is presented (doi:10.5281/zenodo.1307309). The reconstruction which integrates geographical information from historical maps and satellite images from SPOT, is spatially explicit with a 500 x 500m resolution and distinguishes six land cover classes: forests, grasslands, agriculture land, inland water, built-up, and bare soil.
Taiwan, as a developing country, has gone through a not unusual sequence of population growth and subsequent urbanization, a decoupling of the demand for agricultural land from population growth, and a transition from shrinking in forest area to forest expansion since 1904. By using the assumptions, long-term average regional deforestation rate and/or a mean growth rate of the human population to reconstruct the Taiwan’s land cover maps may have a low credibility for the applications. By checking bi-lateral exchanges of a pair of land cover types, we found that the long-term gross change rate is about one order of magnitude higher than the net change rate during the whole reconstructed period (Chen et al., 2019), which is similar to the outcome of a large scale land cover reconstruction reported by Fuchs et al., (2015) in Europe.
Land use/land cover changes will lead to the land degradation which might reduce the capability of carbon sequestration and carbon stock in the soil. Avoiding the land degradation and restoring the intact and manmade forests have been considered as a possible approach to mitigate the climate change (Erb et al., 2018). Developing a sustainable forest management is deliberately to provide an optima carbon stock in Taiwanese forests to meet the climate objectivity for the future both in local and large scales. We expected that this new reconstruction can contribute the aforementioned work.
Key points
More information