- About
About RCEC

Faculty/Staff

Education/Visiting/Others

- Our Research
- News
About RCEC
Faculty/Staff
Education/Visiting/Others

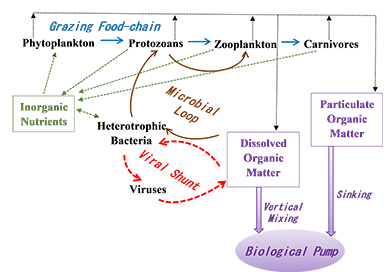
Figure 1. Schematic diagram of marine microbial food web. The diagram presents key microbial processes that critically affects marine biogeochemical cycle, including the inorganic and organic fluxes (arrows) flowing among different plankton via grazing food chain (blue lines), microbial loop (brown lines), viral loop (red dashed lines) and biological pump (purple arrow).
Viruses are thought responsible for c.a. 10~50% of the total bacterial mortality in surface seawater. The viral shunt hypothesis suggested that the viral-lysis process lessened the transfer of bacterial cells to protozoans; and that the lysate released from the broken cells stimulated the growth of the existing bacteria. This viral shunt hypothesis is crucial for microbial biogeochemistry but its applicability to the real world has not been well documented for almost three decades. The research team analysed an eight-year data set taken from the oligotrophic tropical SEATS station (18° N, 116° E), and cracked the puzzle of why this phenomenon has not been seen in the field for almost 30 years. This research has been published in Science Advances on October 12th, 2022.
Pathogenic bacteria and viruses are notorious for destroying the human population and civilization. Yersinia pestis (aka. plague, the black death) took half of the Europeans' life in the Middle Ages, and that COVID-19 has resulted in the highest casualty in human history (6.45 million by August 2022). However, the vast majority (>95%) of these microbes are harmless to us. These non-pathogenic microbes play essential roles in recycling the primary elements that make up all living systems on earth. The ocean has an inventory of dissolved organic carbon (DOC; ~660 Giga-ton C) roughly equal to that of atmospheric CO2. Most oceanic DOC is derived from autochthonous food web processes. Heterotrophic bacteria are responsible for DOC decomposition and constitute a key component in the “microbial-loop” (Fig. 1), which emphasizes the connections between DOC, bacteria, protozoans, and the traditional grazing (phytoplankton to zooplankton to fishes) food chain.
The results from 9 diel surveys (sampling with a 3-hours interval for 24-48 hours; 2010-2017) conducted in the SEATS station of the tropical South China Sea indicated that in terms of tempo-spatial distribution, bacterial abundance (Fig. 2A) and virus abundance (Fig. 2B) changed synchronously (Fig. 2D). While bacteria per cell growth rate (Fig. 2C) varied negatively with that of bacteria (and virus too) abundance (Fig. 2E).
Bacteria are in famine status in an oligotrophic ocean. The supply of labile substances such as the lysate from viral lysis process stimulates bacteria to turnover in a time-scale of hours. The difficulty of detecting the viral shunt in mesotrophic/eutrophic systems might due to their abundant allochthonous and autochthonous organics input sources. The differential temperature responses of the viral shunt modes in the upper and lower euphotic zones provides insights into the viral shunt and the consequential impacts on food web processes (i.e. fueling primary production and bacteriovory) in a warming climate.
Key points
More information
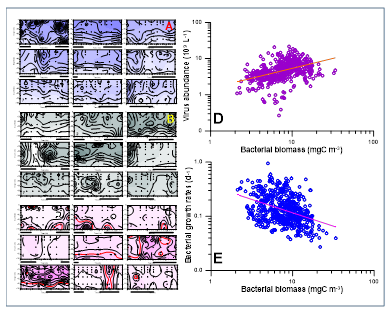
Figure 2. Depth (0-100m) contours of (A) bacterial biomass, (B) viral abundance, (C) bacterial per cell growth rate in the 9 diel surveys. The scatter plots of bacteria biomass vs. (D) virus abundance and (E) bacteria per cell growth rates.