- About
About RCEC

Faculty/Staff

Education/Visiting/Others

- Our Research
- News
About RCEC
Faculty/Staff
Education/Visiting/Others

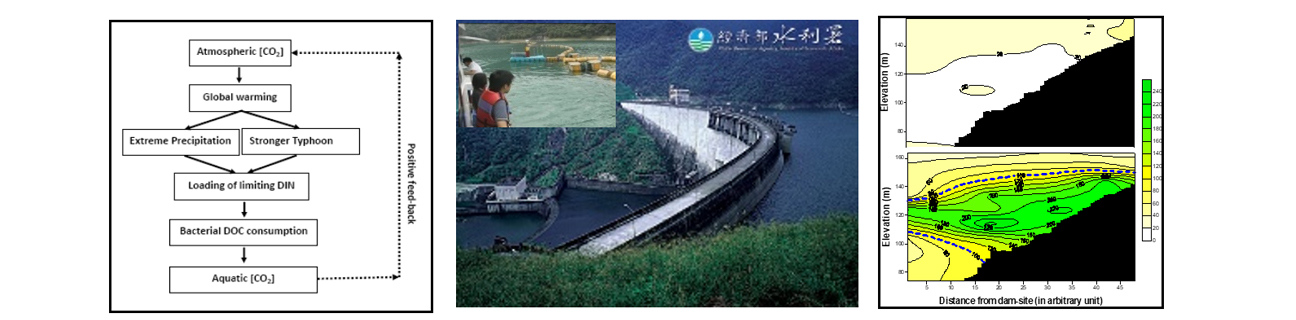
(A), The hypothetic model showing the positive feed-back mechanism of extreme weather events on the changes of chemistry and biology in aquatic and atmospheric systems. (B), Weekly sampling at the dam-site of Fei-Tsui reservoir (24°54’N, 121°34’E), Taiwan. And (C), depth contours of phosphate concentrations before (upper panel) and after lower panel) typhoon AERE (Aug-23rd~26th, 2004). Dash line indicate phosphate 100 nMP isolines.
The time-series typed study in aquatic ecosystems has been recognized as one of the most effective tools to explore long-term environment/ecosystem changes (A). Since 2004, a time-series type watershed biogeochemical observatory has been established in Fei-tsui reservoir. And weekly sampling has been conducted at the dam-site (B). Previous study indicated that during typhoon events, the major source of algal growth-limiting nutrient (i.e. phosphate) came from the mid-water (60~80 m depth) hyperpycnal flow (C)) originated from the tributaries’ input. Here we report the analysis results of the field observations of a total 36 typhoon cases in a subtropical deep freshwater ecosystem (i.e. Fei-tsui reservoir) in the period of 2005-2014, we quantified phytoplankton biomass, production and growth rate in response to meteorological and hydrological changes in the weeks before, during and after typhoons between summer and autumn, and also investigated the effects of typhoon characteristics on the aforementioned phytoplankton responses. The results showed that phytoplankton exposed to typhoon disturbances generally exhibited an increasing trend over the weeks before, during and after typhoons in summer but varied in autumn. The correlations and multivariate regressions showed different contributions of meteorological and hydrological variables to individual phytoplankton responses before, during and after typhoons between seasons. The post-typhoon weeks (i.e., within two weeks after a typhoon had passed) were especially important for the timeline of phytoplankton increases and with a detectable seasonal variation that the chlorophyll a concentration significantly increased in autumn whereas both primary production and growth rate were associated with significant changes in summer. Additionally, phytoplankton responses during the post-typhoon weeks were significantly different between discrete or continuous types of typhoon events. Our work illustrated the fact that typhoons did influence phytoplankton responses in the subtropical deep freshwater ecosystem and typhoon passages in summer and autumn affected the phytoplankton dynamics differently. Nevertheless, sustained and systematic monitoring in order to advance our understanding of the role of typhoons between seasons in the modulation of phytoplankton productivity and functioning is required because such episodic climatic disturbances are projected to have intense magnitude and inconsistent frequency under 21st century climate change.
Key points
More information
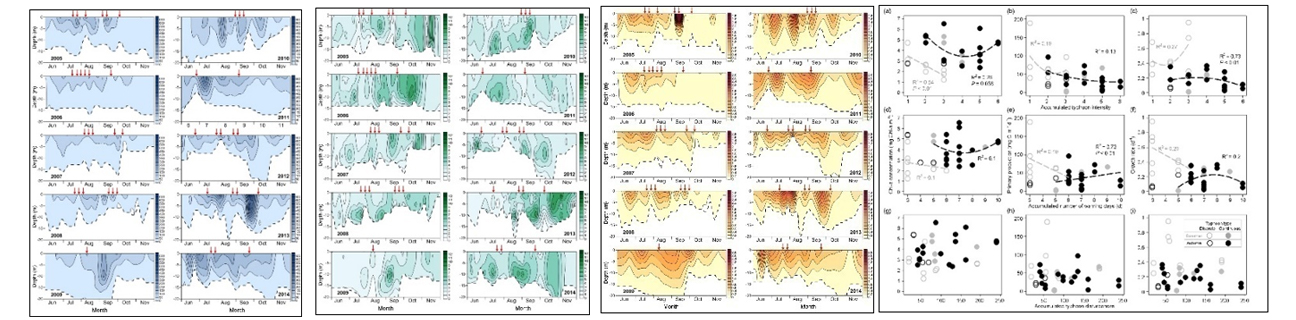
Fig2: Weekly data of (D) chl-a concentration (mg chl-a m-3) , (E) primary production (mgC m-3 d-1) and (F) growth rate (d-1) profiles in the warm season for the period 2005~2014. Dashed lines indicate the euphotic depth. Red arrows indicate the weeks in which a typhoon occurred. And (G) scatter plots of the chl-a concentration, primary production and growth rate in relation to the accumulated typhoon intensity (a–c), accumulated number of warning days (d–f), and accumulated typhoon disturbances (g–i) during the post-typhoon weeks in the summer and autumn seasons for the period from 2005 to 2014. Regression lines (dashed lines), values of regression (R2) and significant P-values shown in the figures were calculated based on values for the discrete typhoon events in summer (gray) and the continuous typhoon events (black) in summer and autumn.